Web platform for the integration of weather and social media data during extreme weather events

Open Source code from Geosoft II seminar at ifgi, winter semester 2019/20

Organisation page

About the course

During the winter semester 2019/20 the bachelor students at the Institute for Geoinformatics (ifgi) worked on a solution to integrate social media data and near real-time precipitation data in a disaster management scenario. For the students this was the first time they designed, documented, and implemented an API, connecting a server and a client compent, and had to integrate external data via APIs. The participants also had to improve their data visualisation skills with complex map and filtering user interfaces, and package the created software in containers for deployment and evaluation. Finally, they even had to realise a performance test suite.

You can download the full project requirements document for details. The short descriptions below highlight the differences of the student groups' realisations of the requirements.


The course was taught by Christian Knoth, Daniel NĂ¼st and Edzer Pebesma.

LSF Nr.: 144929 —  Learnweb


Projects

In the following we will shortly present the results of the groups. All source code is open source and available on GitHub: https://github.com/organizations/Geosoft2/
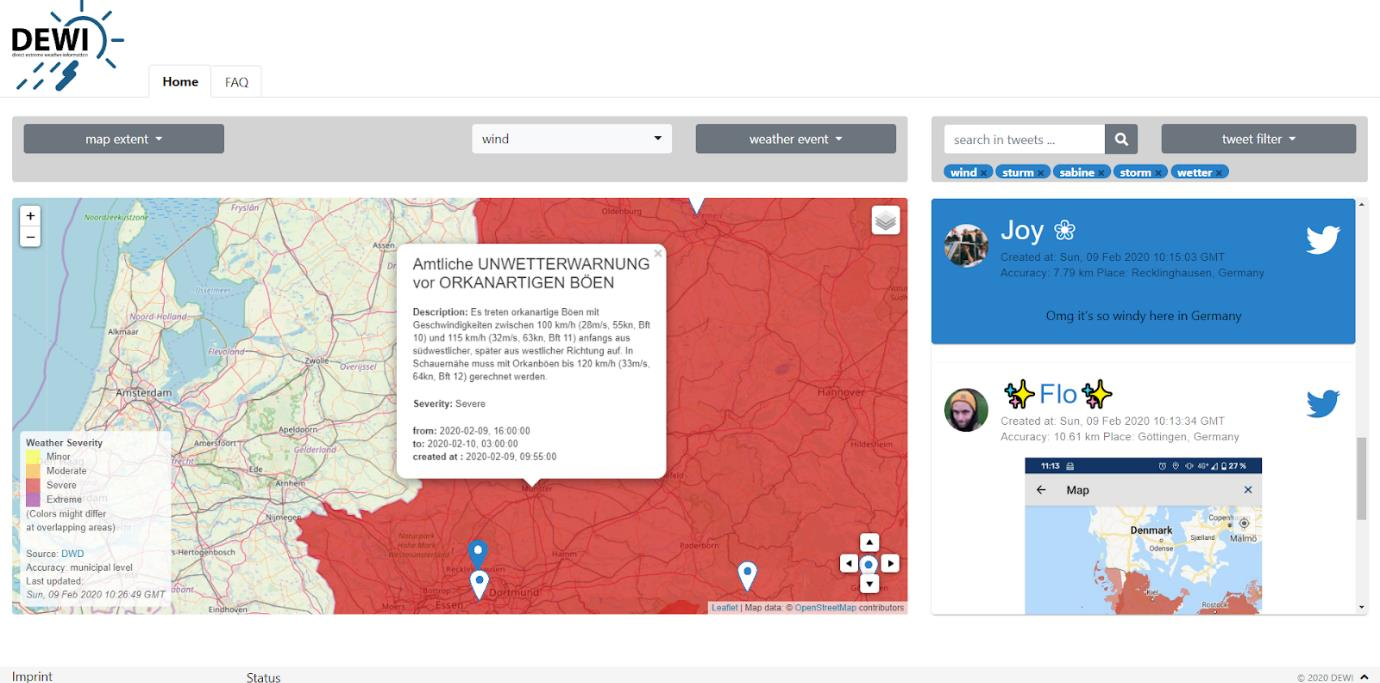
DEWI

Direct Extreme Weather Information integrates DWD extreme events data from a WMS with Twitter social media data. The application is based on Node.js and features notifications for new events using email and Mattermost chat rooms.

Code: https://github.com/Geosoft2/DEWI_Geosoft2_WS19-20_huef_jaku_nier_nisk_sten
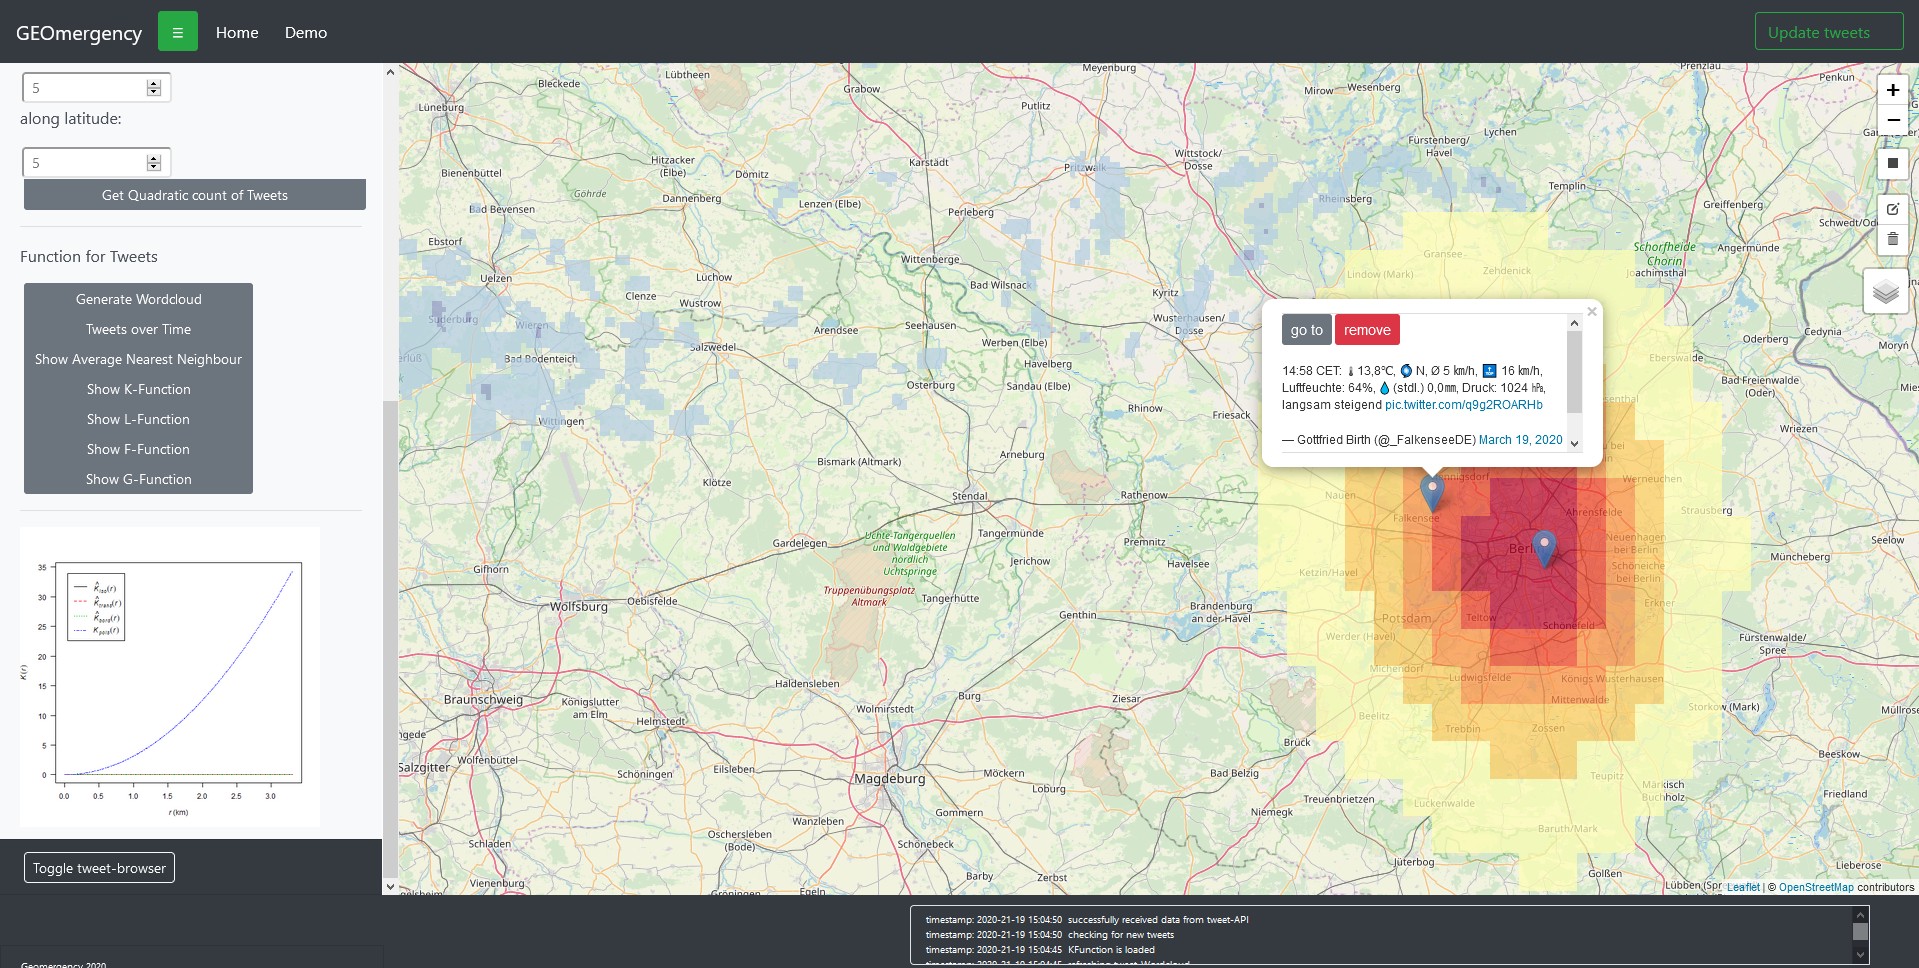
DEWI screenshot

GeoMergency

The GeoMergency project uses Node.js and R (with the plumber package) to create an API with extreme event observations and tweets.

Code: https://github.com/Geosoft2/GeoSoft2_Gruppe2
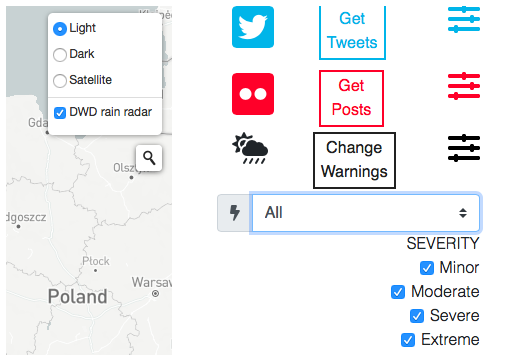
GeoMergency screenshot

Salus Solutions

The application weathr integrates social media posts from both Twitter and Flickr and uses a Node.js backend.

Code: https://github.com/Geosoft2/Geosoftware2-1
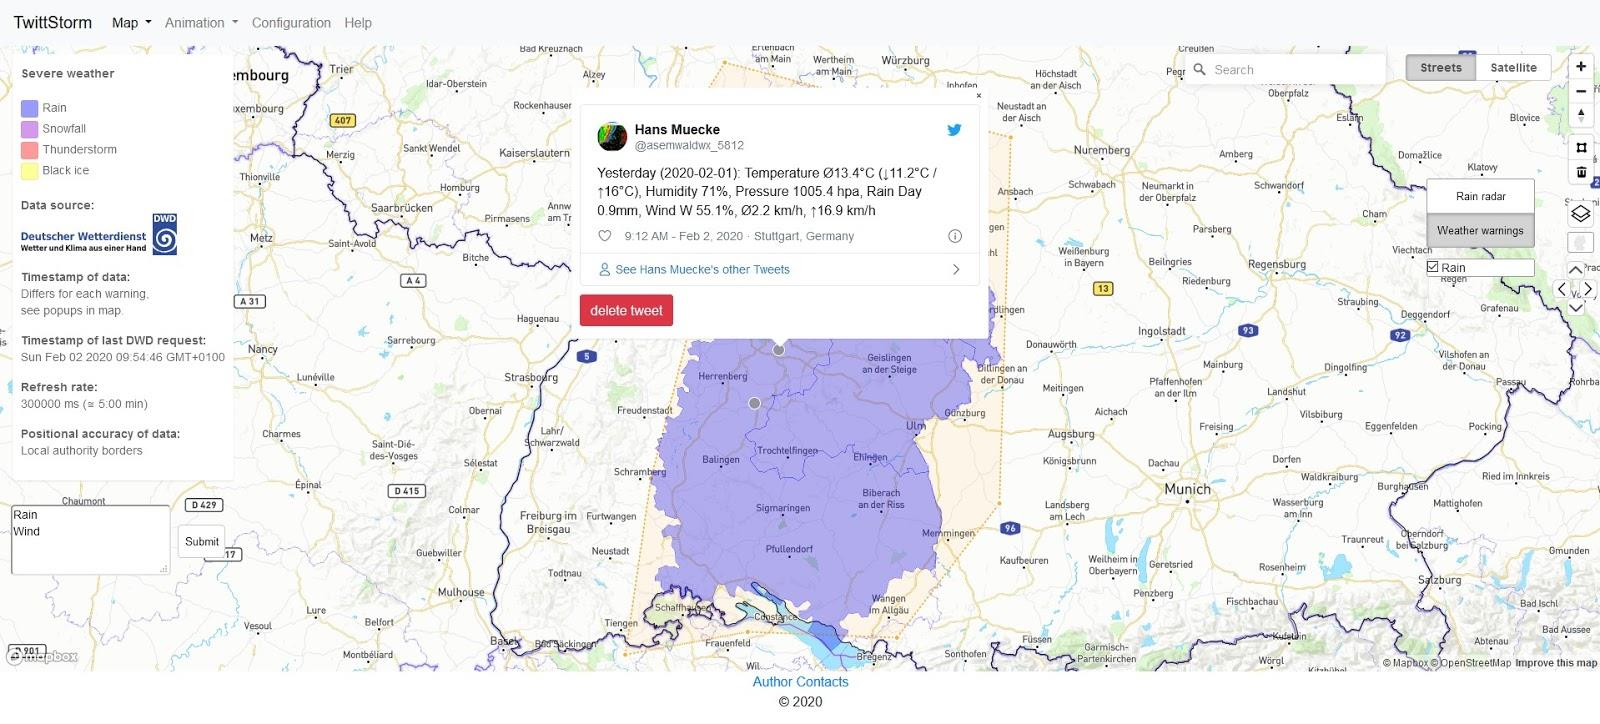
Salus screenshot

TwittStorm

TwittStorm uses a Node.js backend to integrate DWD severe weather data and Tweets into a map, which features animation of the recent period of time to see new posts appear.

Code: https://github.com/Geosoft2/TwittStorm

TwittStorm screenshot